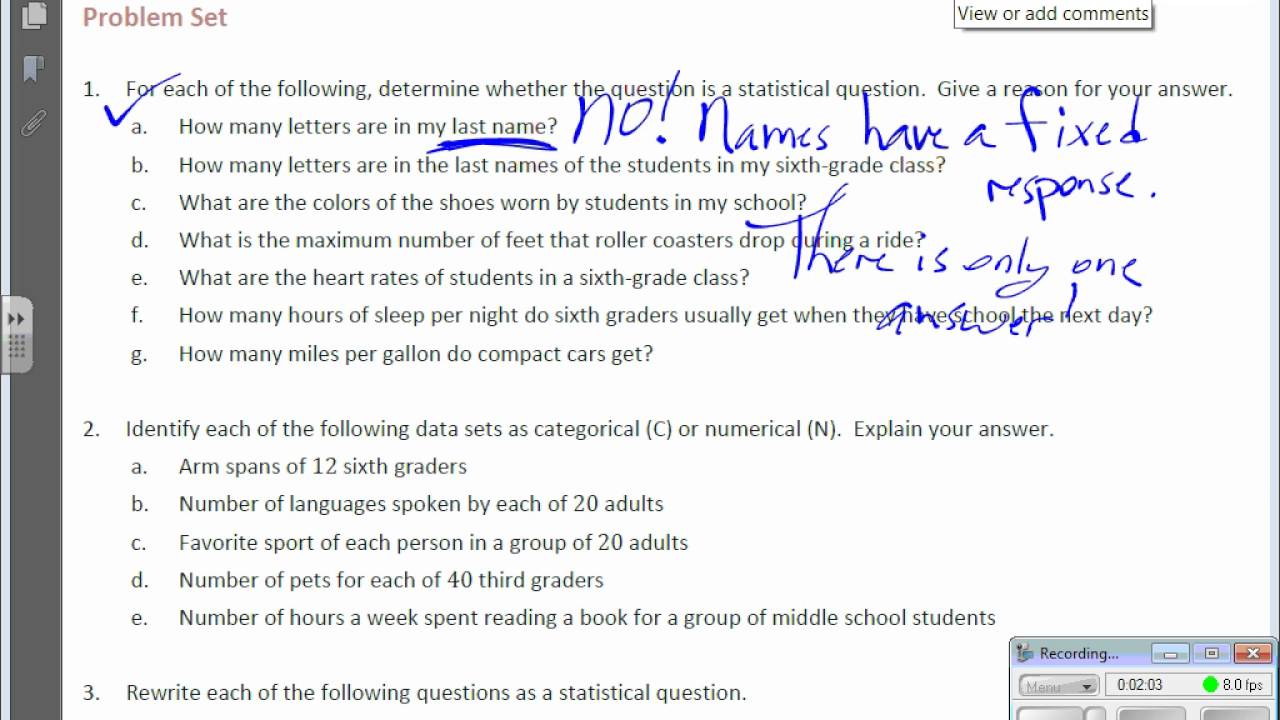
This video introduces the concept of statistical questions. What is a statistical question? Also, numerical and categorical data is defined.
آپ کو یہ بھی پسند آ سکتا ہے
Mathematics (Junior Secondary School 1)
Cambridge primary maths lectures
Mathematics | Primary 1
Matholia Primary 3
Singapore Math P1 (Grade 1) Teaching Videos by Teachers
Class 2 CBSE Maths Syllabus Videos
Primary Mathematics book 1A Complete Explanation and Solution
Class Three English Version Math | তৃতীয় শ্রেণির গণিত
২য় শ্রেণি প্রাথমিক গণিত (Class 2 General Math)
Chance and Probability for Kids and More
Class 11 Applied Mathematics (Session 2023-24) | Complete CBSE/NCERT Course Available
Cyberchase | PBS KIDS
Aulas para o 8º ANO do Ensino Fundamental
Curso completo de matemática - Ensino Médio - Matemática Contexto e Aplicações - Dante: Volume 1 - Resolução de Exercícios
حلول تمارين الكتاب المدرسي الثانية ثانوي رياضيات
Matematik Tahun 2 Buku Aktiviti
SS 1 Mathematics
SS 2 Chemistry
English lessons for kids - My English teacher
SS 1 Business & Finance
SS 1 English
BabyBus | Kids Cartoon | Stories for Kids | #Reading
Primary 5 Mathematics
Masha & the Bear
تبصرے
10 تبصرے
This video discusses the mean (average) as a balancing point. Diagrams model how to find values that allow the balancing point to be maintained.
This video discusses the mean (average) as a balancing point. Diagrams model how to find values that allow the balancing point to be maintained.
This video shows how to find the center of distribution, also known as the mean or average. Visuals are used to find the values.
This video shows how to find the center of distribution, also known as the mean or average. Visuals are used to find the values.
This video shows how to find relative frequency values from a frequency table. Those values are also converted into percentages.
This video shows how to find relative frequency values from a frequency table. Those values are also converted into percentages.
This video discusses frequency tables with modules and then creates a histogram from the same data. Symmetrical, skewed left, and skewed right curves are introduced as well. (Sorry. I misspelled skewed on the video!)
This video discusses frequency tables with modules and then creates a histogram from the same data. Symmetrical, skewed left, and skewed right curves are introduced as well. (Sorry. I misspelled skewed on the video!)
This video shows how to build dot plots and frequency tables from a set of data.
This video shows how to build dot plots and frequency tables from a set of data.