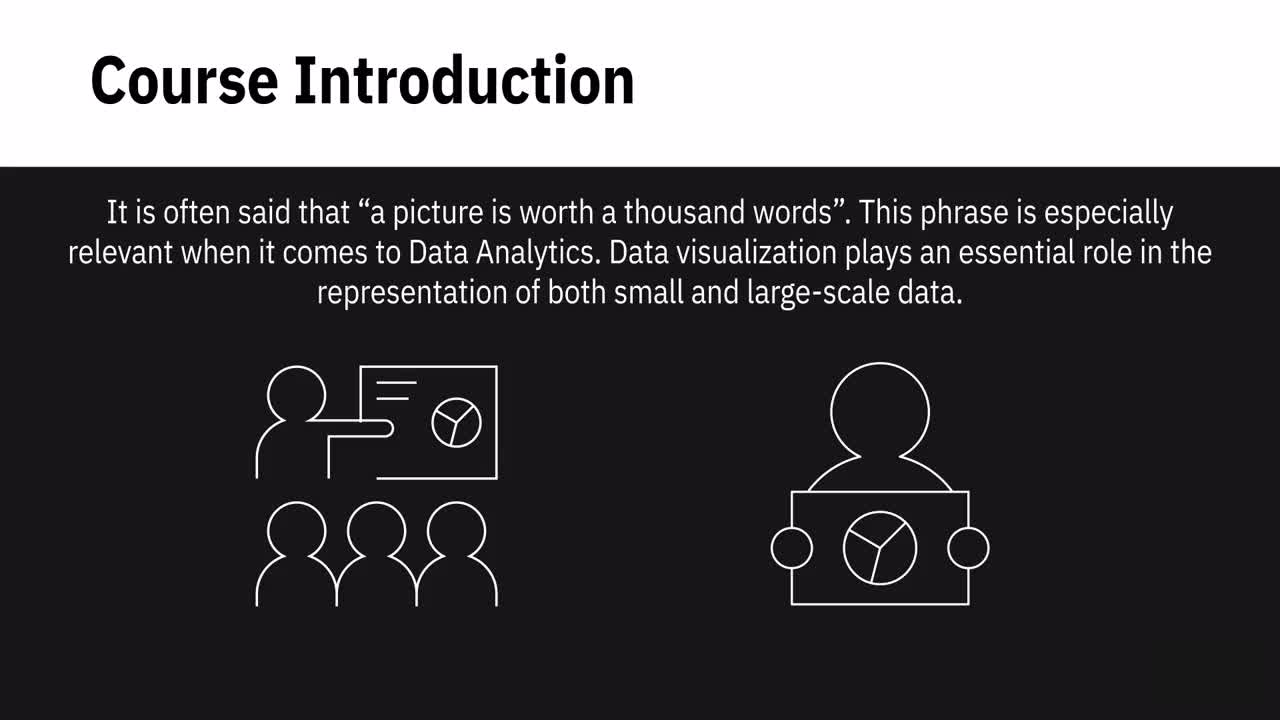
Learn how to create data visualizations and dashboards using spreadsheets and analytics tools. This course covers some of the first steps for telling a compelling story with your data using various types of charts and graphs. You'll learn the basics of visualizing data with Excel and IBM Cognos Analytics without having to write any code. You'll start by creating simple charts in Excel such as line, pie and bar charts. You will then create more advanced visualizations with Treemaps, Scatter Charts, Histograms, Filled Map Charts, and Sparklines. Next you’ll also work with the Excel PivotChart feature as well as assemble several visualizations in an Excel dashboard. This course also teaches you how to use business intelligence (BI) tools like Cognos Analytics to create interactive dashboards. By the end of the course you will have an appreciation for the key role that data visualizations play in communicating your data analysis findings, and the ability to effectively create them. Throughout this course there will be numerous hands-on labs to help you develop practical experience for working with Excel and Cognos. There is also a final project in which you’ll create a set of data visualizations and an interactive dashboard to add to your portfolio, which you can share with peers, professional communities or prospective employers.
آپ کو یہ بھی پسند آ سکتا ہے
Kids Songs by CoComelon
Primary 1 English
CoComelon
Shapes, Colors, & Music by CoComelon
Masha & the Bear
Year4 English
Family Fun by CoComelon
Test Your English with TV Series and Movies
Classic Fairy Tales: Season 1
Hank's Big Adventure!
ABC Jamboree by StoryBots
Careers in business, marketing and finance
Mighty Little Bheem | Netflix Jr.
Princess Songs and Nursery Rhymes for Babies - CoComelon Kids Songs
Numbers Songs by StoryBots
Counting & Numbers Songs by CoComelon
March 2024 KIDS Songs from LooLoo Kids
CoComelon | Netflix Jr
CoComelon Learn ABCs #Shorts!
Bengali Kids Cartoon Videos
CoComelon Lane | Netflix Jr
ABC Videos: Write the Letter - Alphabet Writing Lessons for Children
ChuChu & Friends in Storytime Adventures - ChuChu TV
Happy Holidays from Netflix Jr!
تبصرے
10 تبصرے
Advanced Capabilities in Cognos Analytics Dashboards
Advanced Capabilities in Cognos Analytics Dashboards
Advanced Capabilities in Cognos Analytics Dashboards
Creating a Simple Dashboard in Cognos Analytics
Creating a Simple Dashboard in Cognos Analytics
Creating a Simple Dashboard in Cognos Analytics
Navigating in Cognos Analytics
Navigating in Cognos Analytics
Navigating in Cognos Analytics
Cognos Analytics: Introduction and How to Sign Up