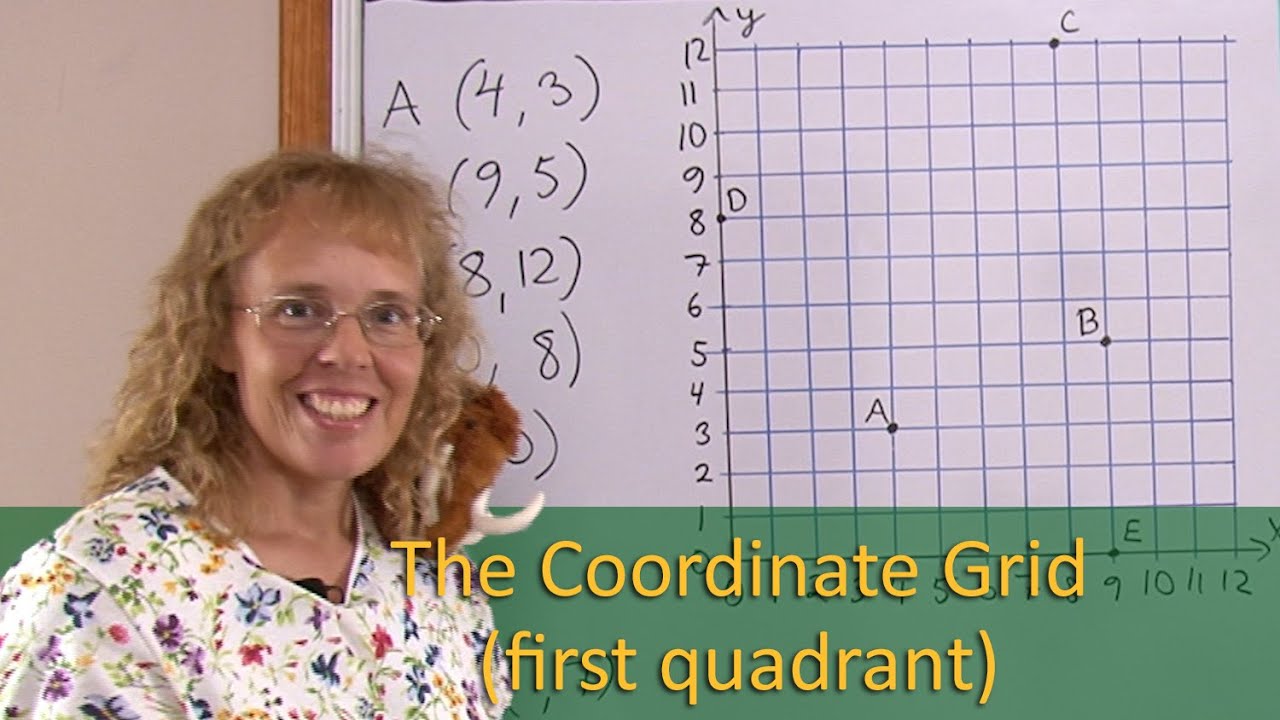
I show how to plot points on the coordinate grid, and how to find the x amd y-coordinates of points already plotted. Then we draw a triangle, and move it four units up and five units to the left, in the grid.
Mungkin Anda Juga Suka
Kids Songs by CoComelon
Primary 1 English
CoComelon
BEST SONGS for TODDLERS 👶🎵 (1 to 3 year olds)
BEST of CoComelon Bath Song + Wheels on the Bus
Shapes, Colors, & Music by CoComelon
Masha & the Bear
Year4 English
Family Fun by CoComelon
Test Your English with TV Series and Movies
Classic Fairy Tales: Season 1
Hank's Big Adventure!
ABC Jamboree by StoryBots
Careers in business, marketing and finance
Mighty Little Bheem | Netflix Jr.
Princess Songs and Nursery Rhymes for Babies - CoComelon Kids Songs
Numbers Songs by StoryBots
Counting & Numbers Songs by CoComelon
March 2024 KIDS Songs from LooLoo Kids
CoComelon | Netflix Jr
CoComelon Learn ABCs #Shorts!
Bengali Kids Cartoon Videos
CoComelon Lane | Netflix Jr
ABC Videos: Write the Letter - Alphabet Writing Lessons for Children
Komentar
10 Komentar
What does the mean (average) of a data set actually signify? This lesson doesn't focus on HOW to calculate it (though I cover that too), but instead, presents several example problems that involve the arithmetic mean in some manner. In the last problem I ask, can you calculate the average from the info given in a bar graph (about people's favorite berries)? This then leads us to use MODE, another statistical measure of center.
What does the mean (average) of a data set actually signify? This lesson doesn't focus on HOW to calculate it (though I cover that too), but instead, presents several example problems that involve the arithmetic mean in some manner. In the last problem I ask, can you calculate the average from the info given in a bar graph (about people's favorite berries)? This then leads us to use MODE, another statistical measure of center.
I show how to draw a basic line graph: we need to choose a scaling for the vertical or y-axis, then draw dots for each of the data items, and lastly connect the dots with line segments. The first example has to do with muffin sales and the other with Mathy's and Giganto's math quiz scores.
I show how to draw a basic line graph: we need to choose a scaling for the vertical or y-axis, then draw dots for each of the data items, and lastly connect the dots with line segments. The first example has to do with muffin sales and the other with Mathy's and Giganto's math quiz scores.
In the first part of this lesson, I construct a histogram using ages of swimming club participants. Those get grouped into bins, and then it's easy to draw the histogram just like a bar graph, but the bars touch each other. Secondly, we have data about girls' and boys' favorite colors, and I draw a double bar graph out of that. Check out my other math videos for 5th grade at
In the first part of this lesson, I construct a histogram using ages of swimming club participants. Those get grouped into bins, and then it's easy to draw the histogram just like a bar graph, but the bars touch each other. Secondly, we have data about girls' and boys' favorite colors, and I draw a double bar graph out of that. Check out my other math videos for 5th grade at
We look at two numerical (linear) patterns created by adding or subtracting the same number (the rule), and their graphs in the coordinate grid. For example, if we add 1 to the x-coordinate and add 2 to the y-coordinate, and plot the points, the resulting graph looks like dots on a LINE - thus the name "linear" pattern. In algebraic terms, in this case, y = 2x, or every y-coordinate is double the x-coordinate. If we subtract the same amount from the y-coordinate each time, (and add some same amount to the x), we get a descending line. Then, I show some linear patterns of dots in the coordinate plane, and the task is to figure out the NUMERICAL patterns for the coordinates. It turns out, we can also visualize the rule for the patterns. For example, if the rule for x is "add 3" and the rule for y is "add 2", we can draw a staircase, just like when determining a slope of a line... the run is 3 units and the rise is 2 units. This lesson covers the common core standard 5.OA.3 about two nume
We look at two numerical (linear) patterns created by adding or subtracting the same number (the rule), and their graphs in the coordinate grid. For example, if we add 1 to the x-coordinate and add 2 to the y-coordinate, and plot the points, the resulting graph looks like dots on a LINE - thus the name "linear" pattern. In algebraic terms, in this case, y = 2x, or every y-coordinate is double the x-coordinate. If we subtract the same amount from the y-coordinate each time, (and add some same amount to the x), we get a descending line. Then, I show some linear patterns of dots in the coordinate plane, and the task is to figure out the NUMERICAL patterns for the coordinates. It turns out, we can also visualize the rule for the patterns. For example, if the rule for x is "add 3" and the rule for y is "add 2", we can draw a staircase, just like when determining a slope of a line... the run is 3 units and the rise is 2 units. This lesson covers the common core standard 5.OA.3 about two nume
This is an introduction to graphing points in the coordinate grid that follow a simple numerical pattern. The patterns we look at all form a linear geometric pattern in the grid (the points look like on a line). The patterns in this lesson are either given algebraically (such as y = 12 - 2x), or we first continue the existing pattern in the given ordered pairs, and then write the rule in algebraic form (such as y = 2x or x + y = 10). The lesson ties in with the common core standard 5.OA.3 and covers most of it, though not completely. The follow-up lesson found here covers the rest of the story: (This common core standard requires that the patterns be given using two given rules, one for the x-values and the other for y-values, whereas in this particular lesson, the patterns are deduced from the given ordered pairs or from the way the x and y values relate to each other.)
This is an introduction to graphing points in the coordinate grid that follow a simple numerical pattern. The patterns we look at all form a linear geometric pattern in the grid (the points look like on a line). The patterns in this lesson are either given algebraically (such as y = 12 - 2x), or we first continue the existing pattern in the given ordered pairs, and then write the rule in algebraic form (such as y = 2x or x + y = 10). The lesson ties in with the common core standard 5.OA.3 and covers most of it, though not completely. The follow-up lesson found here covers the rest of the story: (This common core standard requires that the patterns be given using two given rules, one for the x-values and the other for y-values, whereas in this particular lesson, the patterns are deduced from the given ordered pairs or from the way the x and y values relate to each other.)