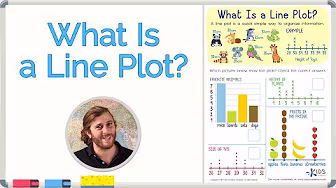
Thousands of parents and educators are turning to the kids’ learning app that makes real learning truly fun. Try Kids Academy with 3-day FREE TRIAL! What Is Line Plot | Math for Grade 2 | Kids Academy Want to know what’s a line plot? Well, here’s a little definition for you. “A line plot is basically a graph that displays data along a number line. There’s a line of X’s or dots that are recorded above the responses just to indicate the number of times a response comes in the data set.” A line plot is an absolutely amazing way to arrange and organize data especially when you have to do a comparison of numbers that are less than 25. All you have to do is to create a table of the data and then draw a horizontal line. Then you need to write down the numbers along the horizontal line and then interpret your data. You will probably read and incorporate the use of line plot in math for grade 2. For further information about a line plot and how it works, you can watch math videos for kids as they are quite useful in this regard. #TalentedAndGifted #LearnWithKidsAcademy Kids Academy Talented and Gifted Program for kids aged 2-10: App Store: Google Play: ***** Subscribe to our channel: Connect with us on : Our site: Facebook: /kidsacademycompany Twitter: /kidsacademyco
आपको ये भी पसंद आ सकते हैं
Year 2 Math
Year7 Maths
Year 1 Math
Year 3 Math
Grade 1 Math
Kelas 1 Matematika
Grade 4 Math
Grade 5 Math
WAEC 2019 MATHS QUESTIONS THEORY
Matematika Hebat
Mathematical Literacy Grade 10
Mathematics Grade 12 Algebraic Expressions, Equations and Inequalities
Algebra I | High School Math | Khan Academy
Kelas 2 Matematika
Polygon Video 1
Grade 8 Mathematics
Kelas 7 Matematika
Grade 10 Mathematics - First Quarter
Grade 4 Mathematics
Kelas 5 Matematika
Equivalent Fractions Video 1
Video 1: Cube Volume
Kelas 6 Matematika Pembelajaran Menurut Topik
Statistics I - Mathematics Form 2
टिप्पणियाँ
1 टिप्पणियाँ
Thousands of parents and educators are turning to the kids’ learning app that makes real learning truly fun. Try Kids Academy with 3-day FREE TRIAL! What Is Line Plot | Math for Grade 2 | Kids Academy Want to know what’s a line plot? Well, here’s a little definition for you. “A line plot is basically a graph that displays data along a number line. There’s a line of X’s or dots that are recorded above the responses just to indicate the number of times a response comes in the data set.” A line plot is an absolutely amazing way to arrange and organize data especially when you have to do a comparison of numbers that are less than 25. All you have to do is to create a table of the data and then draw a horizontal line. Then you need to write down the numbers along the horizontal line and then interpret your data. You will probably read and incorporate the use of line plot in math for grade 2. For further information about a line plot and how it works, you can watch math videos for kids as th