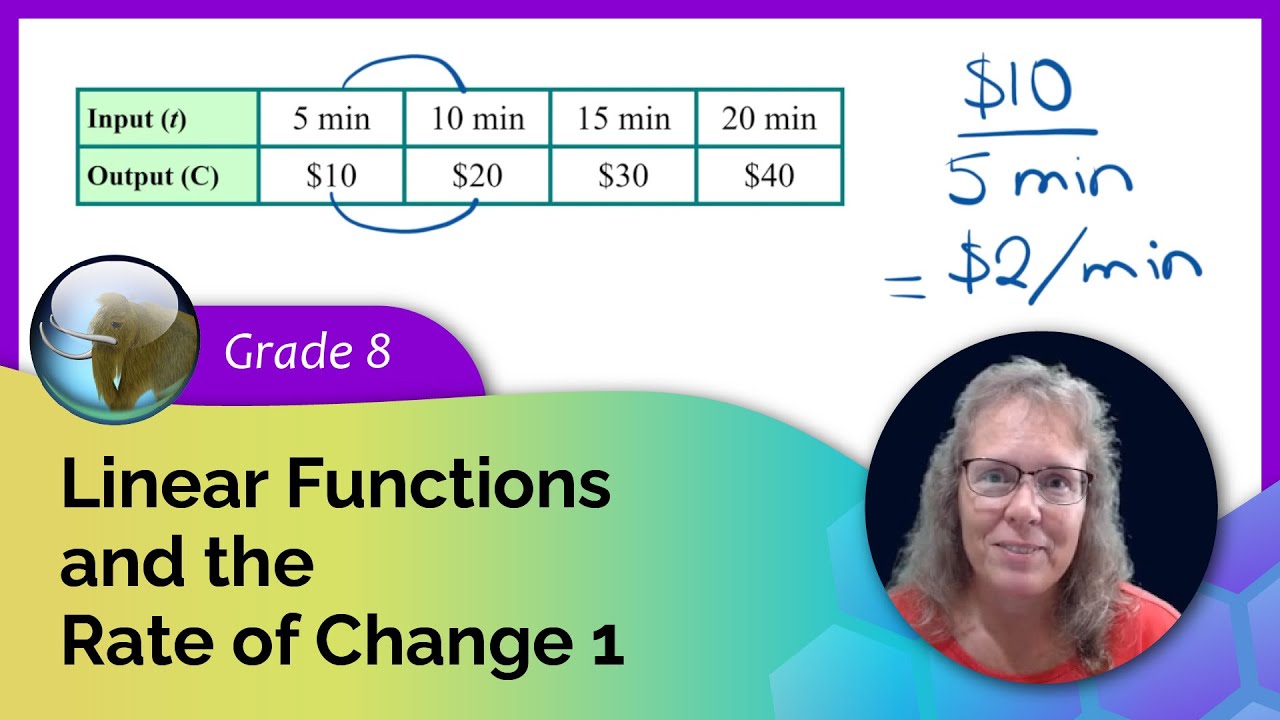
The rate of change of a function is this ratio: (change in the output values/change in the input values). We look at this concept through various examples, calculating the rate of change from tables of values and from the graph of a function. (Later on, you will learn this is the same as slope, in the context of graphing.) Math Mammoth Grade 8 Curriculum
Vous aimerez aussi
SS3 Further Mathematics
Cambridge Primary Mathematics Workbook 5
Grade 5 Mathematics
CLASS 5 MATHS || ENGLISH VERSION || SCHOOL 2020
Primary Mathematics book 1A Complete Explanation and Solution
Grade 3 Mathematics
Class 11 Applied Mathematics (Session 2023-24) | Complete CBSE/NCERT Course Available
Математика 7 класс
Алимов 10 класс
الرياضيات - الثاني متوسط
คณิตศาสตร์พื้นฐาน ม.4 (หลักการนับเบื้องต้น)
الرياضيات - السادس الابتدائي - المنهاج الجديد
แบบฝึกหัดคณิตศาสตร์ ป.3 เล่ม 1
10 класс математика
CBSE Class 10 Maths Full Course: All Chapters Simplified
Kelas 5 Matematika Pembelajaran Menurut Topik
GRADE 9 MATHEMATICS
คณิตศาสตร์ DLTV ป.6
Kids Songs by CoComelon
Primary 1 English
Alphabet (ABC) Songs by CoComelon
Popular Kids Songs & Nursery Rhymes Compilations - by BabyBus
Kids Songs by CoComelon & Blippi - Nursery Rhymes
Exams and revision
Commentaires
4 commentaires
In mathematics, a function is a relation between two sets where each element in the first set is mapped to exactly one element in the second set. The first set is the set of INPUTS and the second set is the set of OUTPUTS. So, each input is mapped to exactly one output. But what if some of the outputs are the same? Is that allowed? What if some element has no output? For example, in the example about rooms and their colors, what if some room has no color assigned to it? Is it a function? We also look at some numerical examples where a function is given as a list of ordered pairs. A function can also be given as a rule, such as x mapping to x squared. We look at the graph of that function in the coordinate plane (for certain integer values only). Math Mammoth Grade 8 Curriculum https;//
In mathematics, a function is a relation between two sets where each element in the first set is mapped to exactly one element in the second set. The first set is the set of INPUTS and the second set is the set of OUTPUTS. So, each input is mapped to exactly one output. But what if some of the outputs are the same? Is that allowed? What if some element has no output? For example, in the example about rooms and their colors, what if some room has no color assigned to it? Is it a function? We also look at some numerical examples where a function is given as a list of ordered pairs. A function can also be given as a rule, such as x mapping to x squared. We look at the graph of that function in the coordinate plane (for certain integer values only). Math Mammoth Grade 8 Curriculum https;//
The rate of change of a function is this ratio: (change in the output values/change in the input values). We look at this concept through various examples, calculating the rate of change from tables of values and from the graph of a function. (Later on, you will learn this is the same as slope, in the context of graphing.) Math Mammoth Grade 8 Curriculum
The rate of change of a function is this ratio: (change in the output values/change in the input values). We look at this concept through various examples, calculating the rate of change from tables of values and from the graph of a function. (Later on, you will learn this is the same as slope, in the context of graphing.) Math Mammoth Grade 8 Curriculum