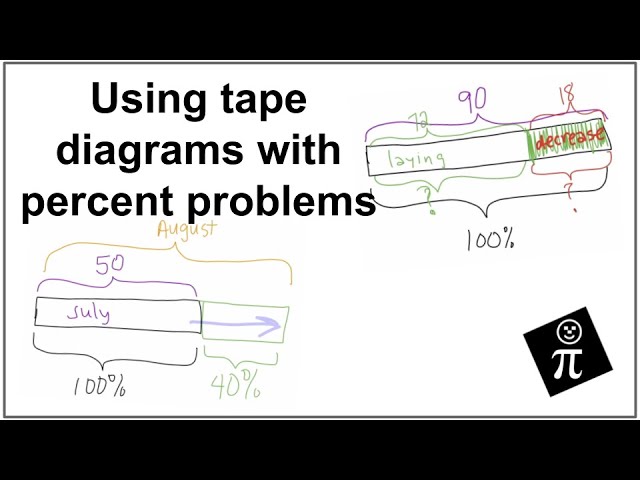
Tape diagrams are amazing! They help us visualize the math problem we are trying to solve. Once the situation is modeled, the arithmetic becomes pretty easy. #TapeDiagrams #TapeDiagramTuesday
Maaari Mo Ring Magustuhan
PrePrimary Maths
Year7 Maths
3rd Grade Math
Introduction to Software Engineering
Yes Yes Songs! CoComelon Nursery Rhymes Mix
Play CoComelon on YouTube!
Mix - Every CoComelon Wheels on the Bus Ever!
Pink Panther Show | Compilations
Letters and Letter Sounds
Kids Songs by CoComelon
Primary 1 English
CoComelon
Alphabet (ABC) Songs by CoComelon
CocoMelon | Little Baby Bum | Blippi - Nursery Rhymes & Kids TV Shows
CoComelon - Happy Holidays
Learn English With Disney Movies
The Original CoComelon Alphabet Series
CoComelon For Journeys
Masha and the Bear 📱 Shorts!
ABC Songs for Kids - CoComelon Nursery Rhymes
CoComelon Dance Party | Dance Along & Kids Songs
English lessons for kids - My English teacher
Nursery Rhymes by CoComelon
English Fairy Tales @EnglishFairyTales
Mga Komento
10 Mga Komento
Use a tape diagram to convert a fraction to a percent. #math #TapeDiagram #TapeDiagramTuesday
Use a tape diagram to convert a fraction to a percent. #math #TapeDiagram #TapeDiagramTuesday
What is the new price for a shirt that normally costs $18.50, but is now on sale for 20% OFF? We use tape diagrams and tables to make sense of percent decrease problems.
What is the new price for a shirt that normally costs $18.50, but is now on sale for 20% OFF? We use tape diagrams and tables to make sense of percent decrease problems.
18.5 is increased by 20%. We use tape diagrams and tables to make sense of percent increase problems.
18.5 is increased by 20%. We use tape diagrams and tables to make sense of percent increase problems.
60% of 40 is what number? We use tape diagrams and tables to make sense of this problem.
60% of 40 is what number? We use tape diagrams and tables to make sense of this problem.
9 out of 15 is what percent? We will use a tape diagram and a table to make sense of this problem!
9 out of 15 is what percent? We will use a tape diagram and a table to make sense of this problem!