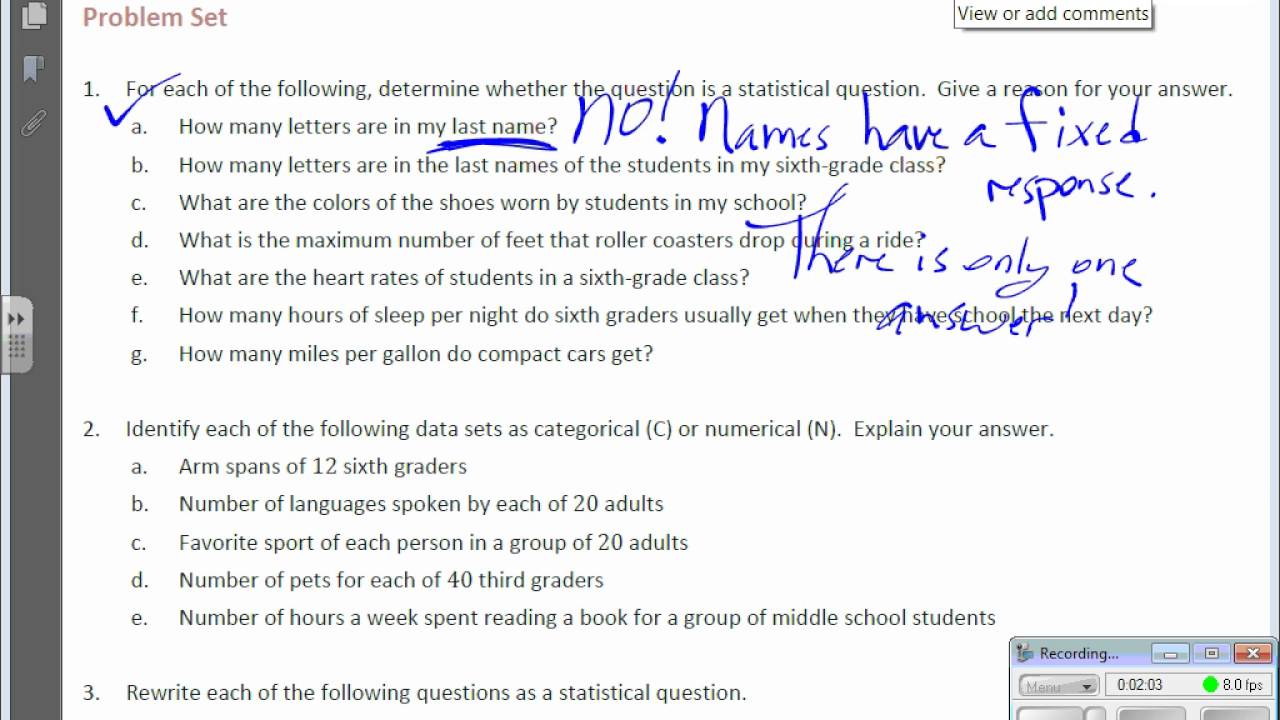
This video introduces the concept of statistical questions. What is a statistical question? Also, numerical and categorical data is defined.
قد يعجبك أيضًا
Kids Songs by CoComelon
Primary 1 English
CoComelon
Alphabet (ABC) Songs by CoComelon
CocoMelon | Little Baby Bum | Blippi - Nursery Rhymes & Kids TV Shows
CoComelon - Happy Holidays
Learn English With Disney Movies
The Original CoComelon Alphabet Series
CoComelon For Journeys
Masha and the Bear 📱 Shorts!
ABC Songs for Kids - CoComelon Nursery Rhymes
CoComelon Dance Party | Dance Along & Kids Songs
English lessons for kids - My English teacher
Nursery Rhymes by CoComelon
CoComelon Dance Party - Mix
English Fairy Tales @EnglishFairyTales
Best Nursery Rhymes & Kids Songs - by BabyBus
Animation & Kids Songs collections For Babies | BabyBus
Year1 English
BabyBus | Kids Cartoon | Stories for Kids | #Reading
Baby Learning with CoComelon - Colors, Shapes and Numbers!
Let's learn about.... English Vocabulary for Kids
BEST SONGS for TODDLERS 👶🎵 (1 to 3 year olds)
Masha & the Bear
التعليقات
10 تعليق
This video discusses the mean (average) as a balancing point. Diagrams model how to find values that allow the balancing point to be maintained.
This video discusses the mean (average) as a balancing point. Diagrams model how to find values that allow the balancing point to be maintained.
This video shows how to find the center of distribution, also known as the mean or average. Visuals are used to find the values.
This video shows how to find the center of distribution, also known as the mean or average. Visuals are used to find the values.
This video shows how to find relative frequency values from a frequency table. Those values are also converted into percentages.
This video shows how to find relative frequency values from a frequency table. Those values are also converted into percentages.
This video discusses frequency tables with modules and then creates a histogram from the same data. Symmetrical, skewed left, and skewed right curves are introduced as well. (Sorry. I misspelled skewed on the video!)
This video discusses frequency tables with modules and then creates a histogram from the same data. Symmetrical, skewed left, and skewed right curves are introduced as well. (Sorry. I misspelled skewed on the video!)
This video shows how to build dot plots and frequency tables from a set of data.
This video shows how to build dot plots and frequency tables from a set of data.