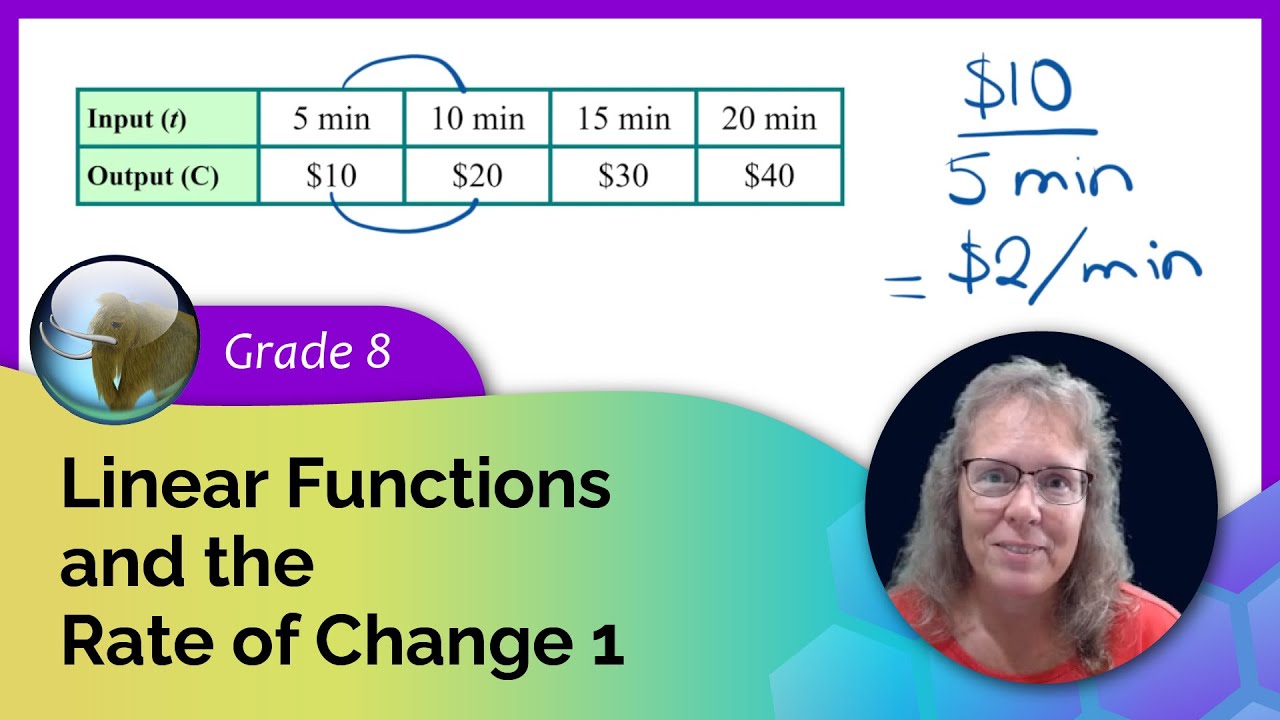
The rate of change of a function is this ratio: (change in the output values/change in the input values). We look at this concept through various examples, calculating the rate of change from tables of values and from the graph of a function. (Later on, you will learn this is the same as slope, in the context of graphing.) Math Mammoth Grade 8 Curriculum
قد يعجبك أيضًا
Kids Songs by CoComelon
Primary 1 English
CoComelon
CoComelon | Netflix Jr
CoComelon Learn ABCs #Shorts!
Bengali Kids Cartoon Videos
CoComelon Lane | Netflix Jr
ABC Videos: Write the Letter - Alphabet Writing Lessons for Children
ChuChu & Friends in Storytime Adventures - ChuChu TV
Happy Holidays from Netflix Jr!
Popular Compilations by CoComelon
Yes Yes Songs! CoComelon Nursery Rhymes Mix
Mix - Every CoComelon Wheels on the Bus Ever!
Pink Panther Show | Compilations
Nick Jr. Mindfulness & Mental Health with PAW Patrol and More 💗
ABCs, 123s, and MORE with Sesame Street and The Children's Kingdom Nursery Rhymes
Letters and Letter Sounds
Nursery Rhymes
Alphabet (ABC) Songs by CoComelon
CocoMelon | Little Baby Bum | Blippi - Nursery Rhymes & Kids TV Shows
CoComelon - Happy Holidays
Learn English With Disney Movies
The Original CoComelon Alphabet Series
CoComelon For Journeys
التعليقات
4 تعليق
In mathematics, a function is a relation between two sets where each element in the first set is mapped to exactly one element in the second set. The first set is the set of INPUTS and the second set is the set of OUTPUTS. So, each input is mapped to exactly one output. But what if some of the outputs are the same? Is that allowed? What if some element has no output? For example, in the example about rooms and their colors, what if some room has no color assigned to it? Is it a function? We also look at some numerical examples where a function is given as a list of ordered pairs. A function can also be given as a rule, such as x mapping to x squared. We look at the graph of that function in the coordinate plane (for certain integer values only). Math Mammoth Grade 8 Curriculum https;//
In mathematics, a function is a relation between two sets where each element in the first set is mapped to exactly one element in the second set. The first set is the set of INPUTS and the second set is the set of OUTPUTS. So, each input is mapped to exactly one output. But what if some of the outputs are the same? Is that allowed? What if some element has no output? For example, in the example about rooms and their colors, what if some room has no color assigned to it? Is it a function? We also look at some numerical examples where a function is given as a list of ordered pairs. A function can also be given as a rule, such as x mapping to x squared. We look at the graph of that function in the coordinate plane (for certain integer values only). Math Mammoth Grade 8 Curriculum https;//
The rate of change of a function is this ratio: (change in the output values/change in the input values). We look at this concept through various examples, calculating the rate of change from tables of values and from the graph of a function. (Later on, you will learn this is the same as slope, in the context of graphing.) Math Mammoth Grade 8 Curriculum
The rate of change of a function is this ratio: (change in the output values/change in the input values). We look at this concept through various examples, calculating the rate of change from tables of values and from the graph of a function. (Later on, you will learn this is the same as slope, in the context of graphing.) Math Mammoth Grade 8 Curriculum